
A Zero-Dependency Dashboard in SAP GUI: ST22, SM37, SM12 and TADIR on One Screen
Emre Göçmen
Author
Every SAP consultant, developer and Basis admin has the same morning routine: open ST22 to see what blew up overnight. Open SM37 to see which job was cancelled. Glance at SM12. And if it is month-end, query TADIR in SE16 and try to remember how many Z objects this system actually has.
Six transactions, six separate screens, and a trend in none of them. Yesterday there were 3 dumps, today there are 19 — you only notice that if you happen to notice it.
In this article we merge those six screens into a single ABAP report. But the real subject is not the dashboard; it is how HTML and JavaScript actually behave inside SAP GUI, and four silent traps nobody writes about. The people who hit those traps conclude “charts don't work in SAP” and give up.
The code is a single file, copy and run. No internet access, no CDN, no SMW0, no MIME repository, no external library.
What it solves
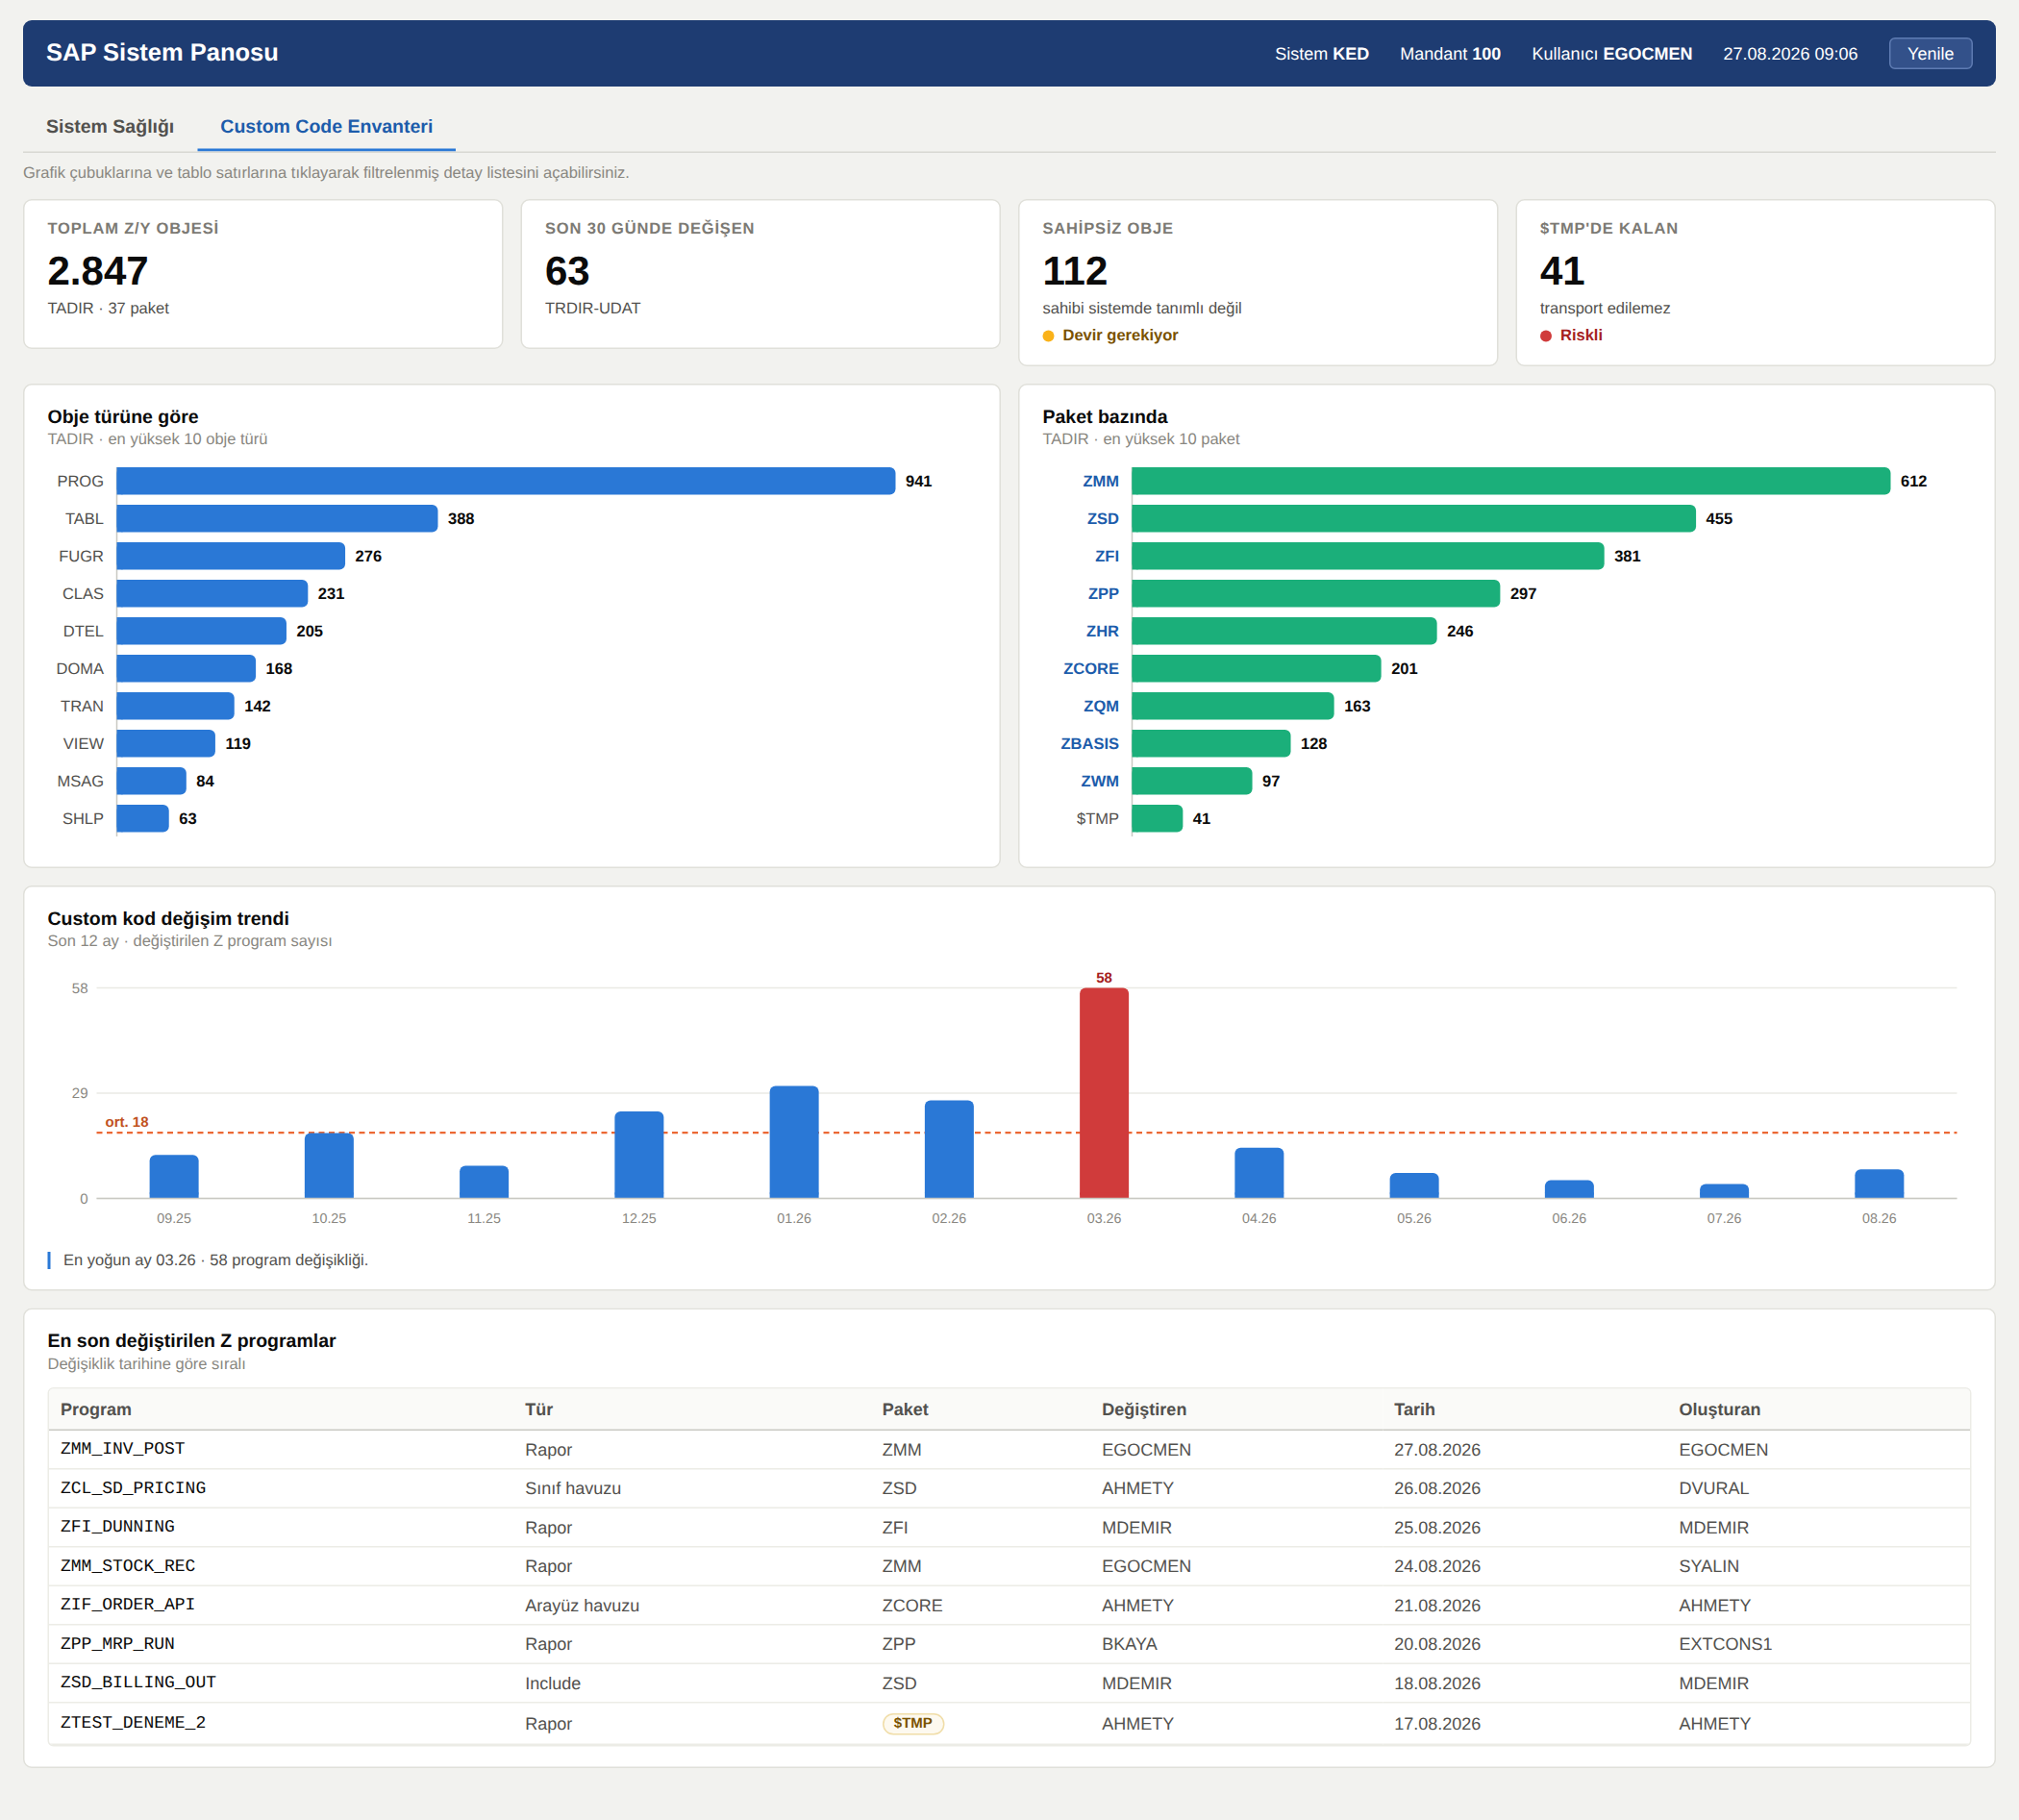
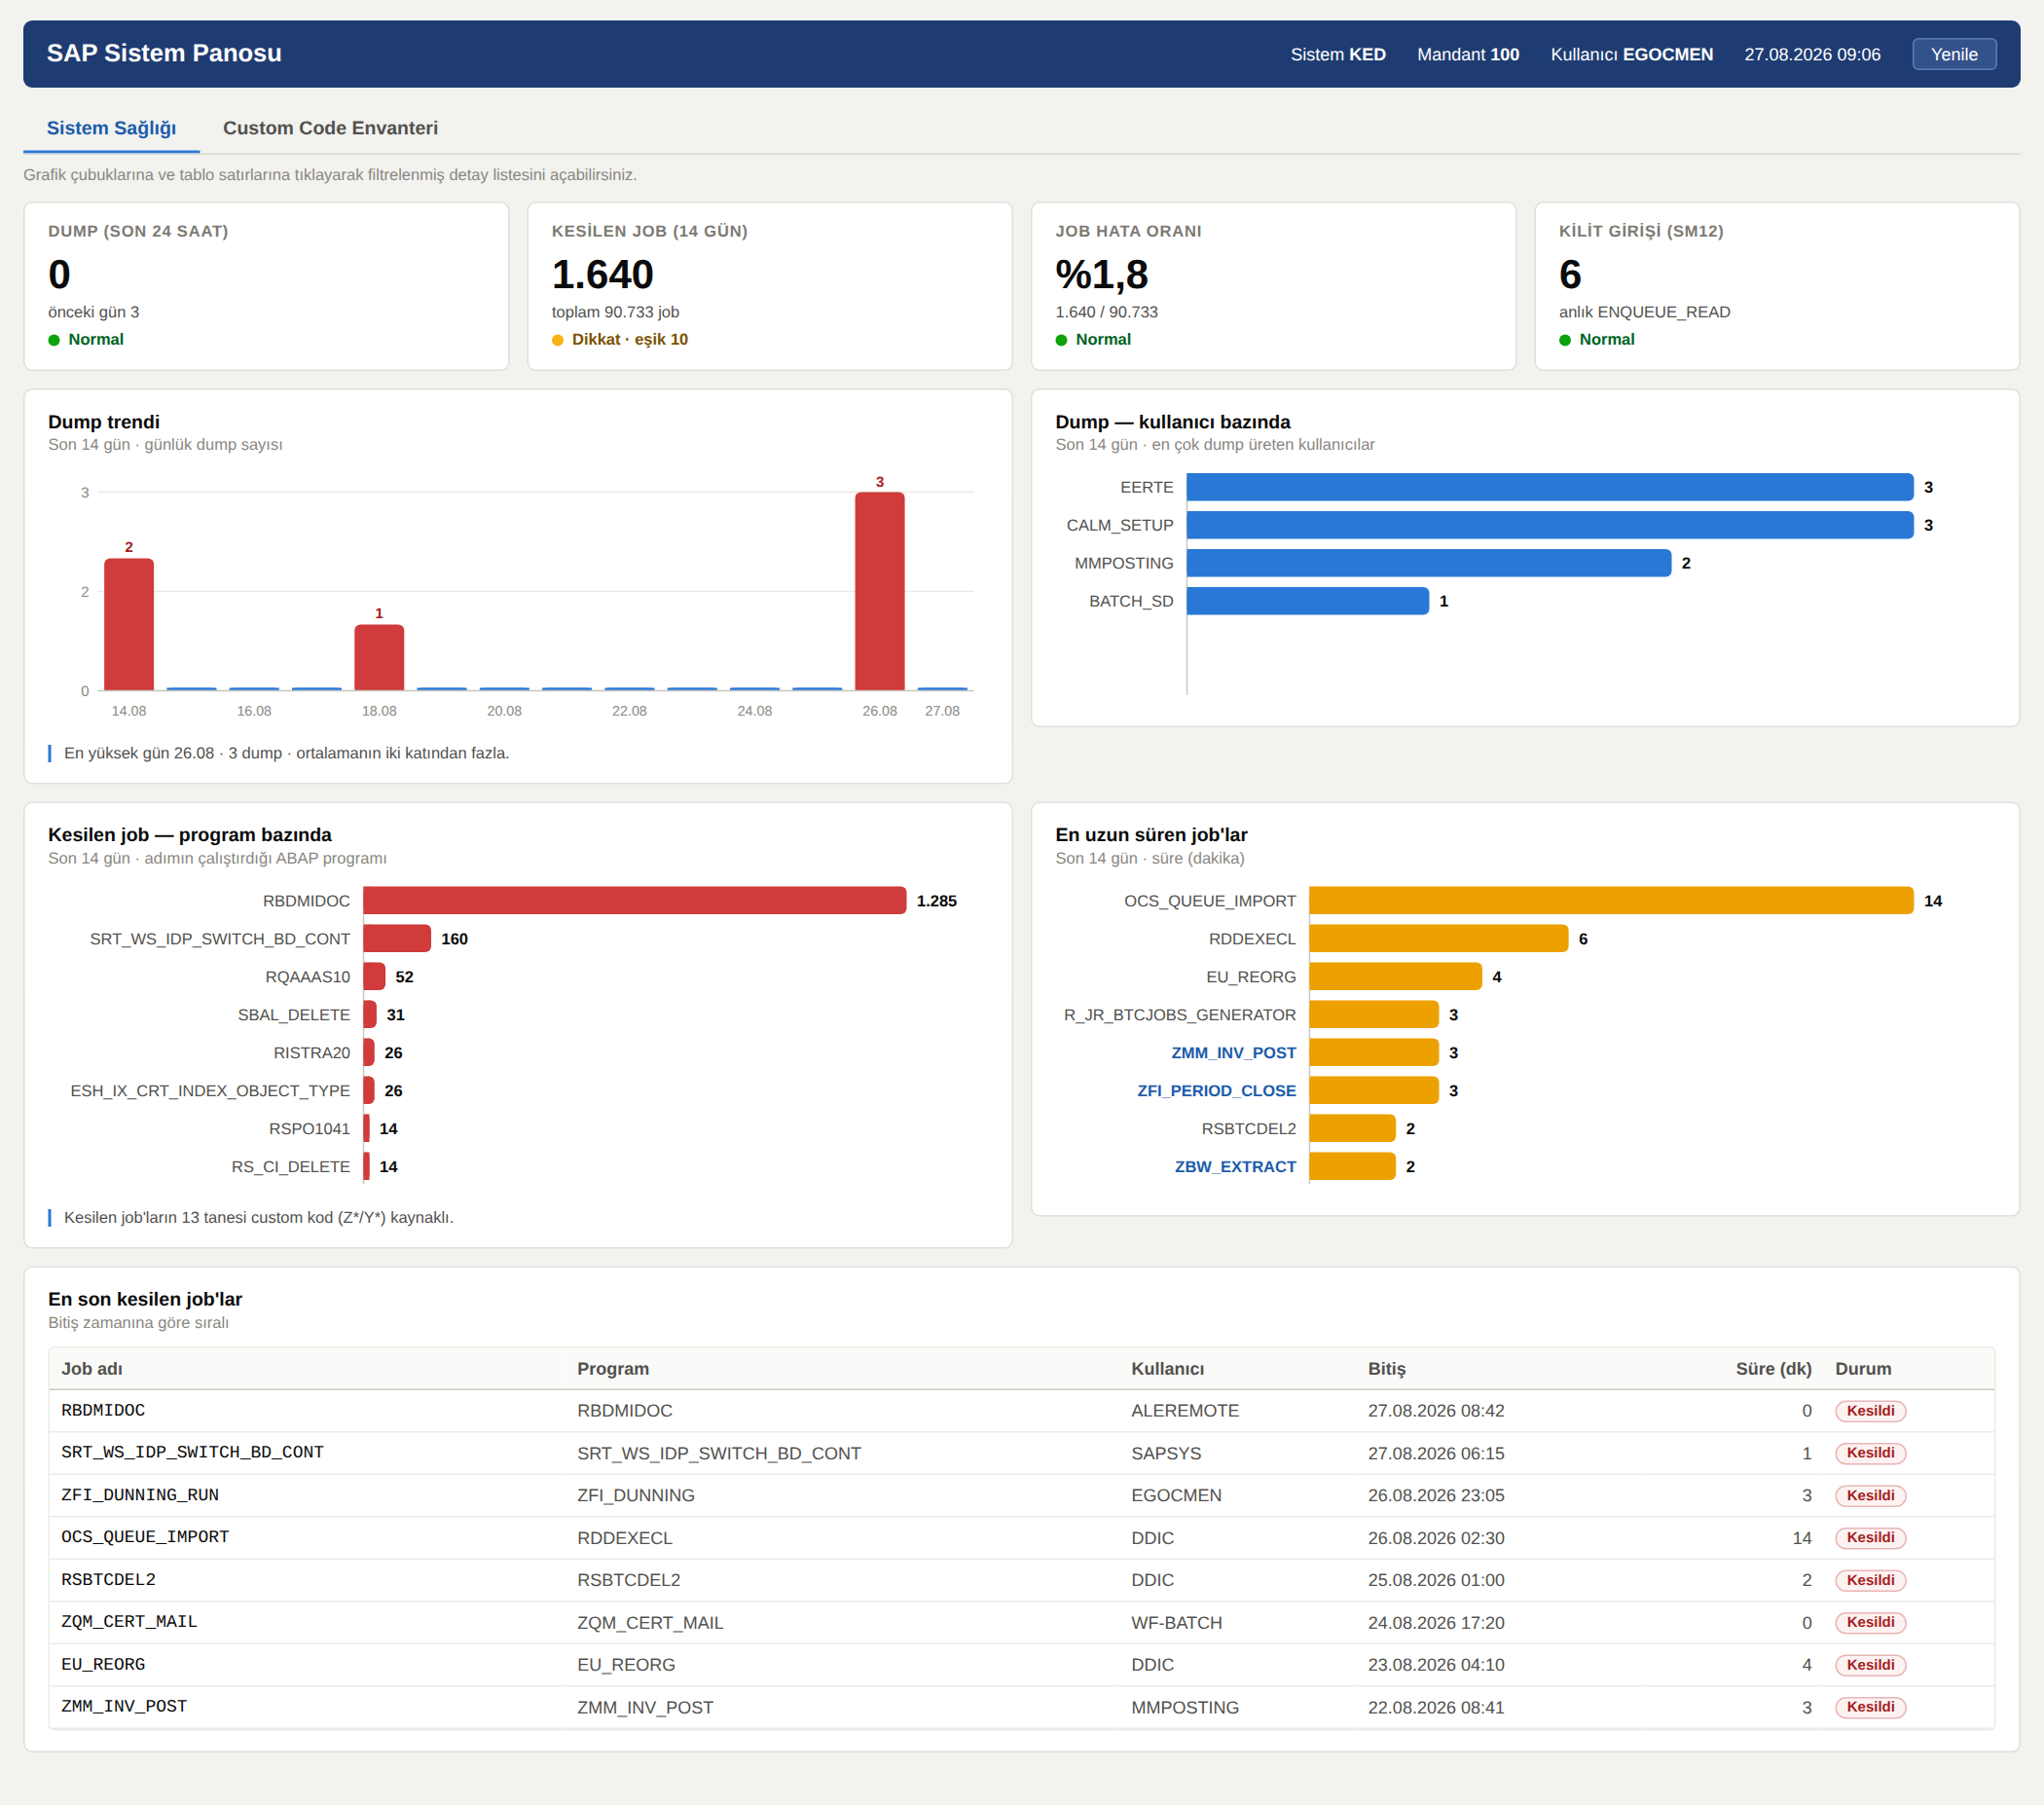
One program, two tabs.
System Health: dump count in the last 24 hours with threshold status, daily dump trend (with an average line, spikes in red), dumps per user, cancelled jobs per program, longest running jobs, current lock entry count, and a list of the most recently cancelled jobs.
Custom Code Inventory: total Z/Y objects, distribution by object type and package, custom code change trend over the last 12 months, objects still sitting in $TMP (and therefore not transportable), “orphaned” objects whose owner no longer exists in the system, and the most recently changed Z programs.
Clicking a chart bar or a table row opens an ALV detail list filtered by exactly what you clicked: a user bar → that user's dumps, a program bar → that program's cancelled jobs, a package bar → the Z objects in that package. Clicking a program row opens SE38 directly.
The two tabs sitting together is not a coincidence. On the system health side there is a note saying how many of the cancelled jobs come from custom code — and the answer is usually higher than you would expect. The custom code inventory is the side that explains where that comes from.
Why not Chart.js
The first instinct is to pull Chart.js or ECharts from a CDN:
<script src="https://cdn.jsdelivr.net/npm/chart.js"></script>Inside SAP GUI's HTML control this line fails silently in most enterprises. The corporate network does not reach the CDN, a proxy gets in the way, or the server has no internet at all. The result: tables and cards render, but an empty <canvas> sits where each chart should be. And since you cannot see the console, you never learn why.
Even if you do reach the CDN, there is a second wall: which browser engine the HTML control uses is decided by the user's machine, not by the server. SAP GUI for Windows runs the HTML control either on the legacy IE engine (MSHTML) or on Edge/Chromium (WebView2). The Edge option arrives locked by the administrator in some installations, and WebView2 version updates have caused problems with SAP GUI in the past (SAP KBA 3191784, KBA 3704912).
So the ES6 that modern Chart.js versions expect works on your machine and fails on your user's. That is a lesson you learn by testing on one machine and shipping to everyone.
Hence the decision: we draw the charts ourselves, as plain SVG with ES5 JavaScript. Two functions of roughly 60 lines (horizontal bar, vertical bar) feed the entire dashboard. Zero external dependencies, identical output in IE and Edge, 17 KB total.
Four silent traps
This part is the real reason for the article. These four things are barely documented anywhere, and all four lead you down the wrong path without ever producing an error message. I hit the fourth one on my first run in a live system.
1. Splitting the HTML into 1000-character chunks breaks JavaScript
This is the pattern you will find in almost every example:
" WRONG
DATA: lv_chunk TYPE c LENGTH 1000.
WHILE lv_offset < lv_len.
  lv_chunk = gv_html+lv_offset(1000).
  APPEND lv_chunk TO gt_html_table.
  lv_offset = lv_offset + 1000.
ENDWHILE.
It breaks in two separate ways. First, the cut can land in the middle of a JS token — the variable dataMtart ends up as dataM at the end of one line and tart at the start of the next. HTML forgives that; JavaScript does not. Second, because TYPE c is fixed length, the last chunk is padded with blanks, and those blanks are written into the file.
The result: the HTML opens, the CSS applies, the table renders, and the JavaScript dies silently. No error message.
The right approach is to never split the string at all — convert it to a UTF-8 xstring and load it as a binary table:
" RIGHT
DATA: lo_conv TYPE REF TO cl_abap_conv_out_ce,
      lv_x    TYPE xstring,
      lt_bin  TYPE solix_tab,
      lv_len  TYPE i.

lo_conv = cl_abap_conv_out_ce=>create( encoding = 'UTF-8' ).
CALL METHOD lo_conv->convert
  EXPORTING data   = gv_html
  IMPORTING buffer = lv_x.

" BOM: so the legacy IE-based control picks the right code page
CONCATENATE cl_abap_char_utilities=>byte_order_mark_utf8 lv_x
       INTO lv_x IN BYTE MODE.

lv_len = xstrlen( lv_x ).
lt_bin = cl_bcs_convert=>xstring_to_solix( lv_x ).

CALL METHOD go_html->load_data
  EXPORTING url = 'panel.html' type = 'text' subtype = 'html' size = lv_len
  IMPORTING assigned_url = lv_url
  CHANGING  data_table   = lt_bin.
The BOM detail also fixes the non-ASCII character problem. If you see ?? on your buttons, this was the cause: <meta charset="utf-8"> alone is not enough, you have to actually send the data as UTF-8.
2. Without cl_gui_cfw=>dispatch, sapevent never fires
To route a chart click back into ABAP you use the sapevent protocol. The JavaScript side is trivial:
function go(action,key){
  window.location.href = 'sapevent:' + action + '?key=' + key;
}
On the ABAP side you register the event:
ls_ev-eventid    = go_html->m_id_sapevent.
ls_ev-appl_event = 'X'.
APPEND ls_ev TO lt_ev.
go_html->set_registered_events( events = lt_ev ).
SET HANDLER lcl_evt=>on_sapevent FOR go_html.
And nothing happens. The reason: events registered with appl_event = 'X' are application events, and they only reach your handler if you dispatch them explicitly inside PAI.
MODULE user_command_0100 INPUT.
  DATA lv_rc TYPE i.
* Without this line the handler never runs
  CALL METHOD cl_gui_cfw=>dispatch IMPORTING return_code = lv_rc.
  ...
ENDMODULE.
One more detail: the handler itself does no work, it only records the request into global variables. Anything that changes the screen flow — CALL TRANSACTION, an ALV popup — belongs in the PAI module. Do it inside the handler and it fights the screen flow.
And a small but maddening detail: do not use encodeURIComponent on the JavaScript side. A key like $TMP arrives as %24TMP and no longer matches the filter on the ABAP side. Technical names already consist of characters that are safe in a query string.
3. COLLECT does not work with a string field, and offsets are forbidden in LOOP AT ... WHERE
The first thing that comes to mind for grouping:
" WRONG -- COLLECT requires a flat structure, STRING makes it deep
TYPES: BEGIN OF ty_kv, k TYPE string, v TYPE i, END OF ty_kv.
COLLECT ls_kv INTO lt_agg.
COLLECT only works with flat structures, and STRING turns a structure into a deep one. You want the type to be string because it goes into JSON as a string, but the grouping has to happen on a flat type:
" Flat type for grouping; convert to string on the way to the chart
TYPES: BEGIN OF ty_agg, k TYPE c LENGTH 60, v TYPE i, END OF ty_agg.
The second trap is in the same family: while computing the monthly trend you want to compare the first 6 characters of udat. But an offset cannot be used in a LOOP AT ... WHERE condition.
" WRONG: LOOP AT lt_trdir ASSIGNING <r> WHERE udat+0(6) = lv_ym.
" RIGHT:
LOOP AT lt_trdir ASSIGNING <r>.
  IF <r>-udat+0(6) = lv_ym.
    ls_kv-v = ls_kv-v + 1.
  ENDIF.
ENDLOOP.
These two at least produce syntax errors, so they warn you — but you still lose half an hour if you don't know why.
4. On the legacy IE engine, CSS variables, flexbox gap and SVG height:auto do not work
I am not writing this one from theory — I hit it in a live system. The first time I opened the dashboard on a real system the top bar looked correct, but the cards had no background, no border and no status dots. The system info read Sistem KEDMandant 100Kullanıcı EGOCMEN, all run together. And the charts were drawn at absurd scales.
Three separate symptoms, one diagnosis: the HTML control was running on the legacy IE engine. The proof was in what did work — the top bar's color was a literal hex value and it rendered; the cards' color came from a CSS variable and it did not.
Concretely, what does not work on the legacy IE engine:
/* 1) CSS custom properties -> never applied, the color disappears */
:root { --surface:#fff; }
.card { background:var(--surface); }     /* WRONG */
.card { background:#ffffff; }            /* RIGHT */

/* 2) flexbox gap -> ignored, elements end up touching */
.row { display:flex; gap:12px; }         /* WRONG */
.row { margin:0 -6px; overflow:hidden; } /* RIGHT: float + padding */
.col { float:left; padding:0 6px 12px; }
.c4  { width:25%; }
The same list includes calc() (partial on older versions) and position:sticky (absent entirely). If you want a sticky table header, use a scrollable container instead.
The third one is sneakier: scaling an SVG with width:100%; height:auto. Modern browsers derive the aspect ratio from the viewBox; legacy IE does not — the chart is either squashed to 150px tall or stretched to an absurd ratio. The fix is to never leave the scaling to the browser: read the container's width at draw time and write width and height onto the SVG as attributes, in pixels.
var W = host.clientWidth || 440;          /* real pixel width */
var H = TP + slots*(RH+GP);
var svg = E('svg',{width:W, height:H, viewBox:'0 0 '+W+' '+H});
There is a side benefit: because every measurement is now computed in pixel space, you can size the label column to the longest label. A program name like ESH_IX_CRT_INDEX_OBJECT_TYPE is no longer clipped. Bind window.onresize to a redraw and the dashboard flows with the SAP GUI window.
In short: when you write this screen your target is not “HTML that works in a modern browser” but HTML that looks the same on an engine from 2013. Accept that up front and your CSS is limited, but the result is identical on every machine.
Architecture: ABAP never writes HTML
The approach that does not scale to 30 reports is sprinkling HTML through your ABAP code. In this program the HTML skeleton lives in exactly one place and contains only two placeholders:
{{DATA}}   ->  var D = {trend:{l:[..],v:[..]}, user:{...}, tJob:[[..],[..]], ...}
{{META}}   ->  var M = {sys:{...}, kpi1:[{...}], kpi2:[{...}], notes:{...}}
ABAP's only job is to produce those two JSON blocks. The KPI cards, the system line and the notes under each chart are rendered by JavaScript, not by HTML — their data comes from M.
The practical benefit: to add a KPI card you don't touch the HTML, you append a row to gt_kpi1 in ABAP. For a new chart it is one <div id="..."> plus one hbar(...) call in the skeleton, and one PERFORM f_kv in ABAP. Change the color palette, the Excel button or an IE compatibility fix in one place and every report you built on it is fixed at once.
The trailing-comma problem is solved with a harmless closing key, so the JSON generator never needs a “is this the last element” check:
CONCATENATE lv_data `x:0};` INTO lv_data.Drill-down: a filtered list instead of an empty selection screen
In the first version a click ran CALL TRANSACTION 'SM37'. It works, but it is useless: the user has to type the program they just clicked into SM37's selection screen by hand. The meaning of the click is lost.
Filling a standard report's selection parameters via SUBMIT ... WITH ... is tempting but fragile: parameter names can change between releases, and I did not want to publish code that fails to compile on your system. So I build the detail list myself — a popup ALV with CL_SALV_TABLE:
FORM f_alv USING iv_title TYPE string it_hdr TYPE tt_hdr
           CHANGING ct TYPE STANDARD TABLE.
  DATA: lo_alv TYPE REF TO cl_salv_table.

  IF ct IS INITIAL.
    MESSAGE 'No record matches the selection' TYPE 'S' DISPLAY LIKE 'W'.
    RETURN.
  ENDIF.

  TRY.
      CALL METHOD cl_salv_table=>factory
        IMPORTING r_salv_table = lo_alv
        CHANGING  t_table      = ct.
    CATCH cx_salv_msg.
      RETURN.
  ENDTRY.

  lo_alv->set_screen_popup( start_column = 5  end_column = 145
                            start_line   = 3  end_line   = 25 ).
  " ... header, column texts, functions
  lo_alv->display( ).
ENDFORM.
This has three advantages. The dashboard stays open — when the popup closes the user is back where they were. The filter is exactly the criterion that was clicked: “EERTE's dumps”, “Z objects in package ZMM”, “Z programs changed in 03.26”. And you supply the column headers yourself, so it reads “Duration (min)” instead of DAKIKA.
The cost is keeping the raw data in memory. The SNAP, TBTCO, TADIR and TRDIR records read at startup stay in global tables and are filtered from there at drill-down time — no second database read.
There is a real performance lesson here too. In the first version I read TBTCP with FOR ALL ENTRIES for all jobs. Nothing went wrong on the test system. On a system with 90,733 jobs in 14 days, that is a FOR ALL ENTRIES with 90 thousand entries. The program name is only needed for the cancelled jobs:
" Cancelled jobs go into their own table and FAE runs ONLY for those
IF lt_abo IS NOT INITIAL.
  SELECT jobname jobcount stepcount progname
    FROM tbtcp INTO TABLE gt_step
    FOR ALL ENTRIES IN lt_abo
    WHERE jobname = lt_abo-jobname AND jobcount = lt_abo-jobcount.
ENDIF.
1,640 entries instead of 90,733. Same result, incomparably lighter.
Data sources and what to watch out for
WhatSourceNoteDumpsSNAPHolds multiple rows per dump. Because the SEQNO field type varies between releases, I used SELECT DISTINCT on the dump key instead of a SEQNO filter. Requires table read authorization.Cancelled jobsTBTCO (STATUS = 'A')Duration = (enddate-strtdate)*86400 + (endtime-strttime) seconds. A job cancelled before it ever started has an empty STRTDATE; without a guard the duration comes out at ~740,000 days and flattens the chart.Job's programTBTCPRun FOR ALL ENTRIES only for the cancelled jobs. And always check that the driver table is not empty — an empty table selects everything.LocksENQUEUE_READThe NUMBER parameter alone is enough for a count. I deliberately left the SEQG3 field names untouched so a release difference cannot break compilation.Z objectsTADIRThe PGMID = 'R3TR' and DELFLAG = space filters are mandatory. Package, object type and owner come from here.Z programsTRDIRUDAT/UNAM for the last change, CNAM for the creator, SUBC for the program type.Orphaned objectsTADIR-AUTHOR vs USR02-BNAMEObjects whose owner no longer exists in the system. The single most useful metric during a handover.
SM13 (update terminations) and SM21 (system log) are deliberately left out. The VBHDR field names and the system log API vary by release, and I did not want to publish code that fails to compile on your system. Adding either one follows the same pattern and takes about 20 lines.
Setup
Nothing is drawn in Screen Painter — the docking container fills the whole screen. Four steps:
SE38 — create the program, paste the code, activate it.
SE51 — create dynpro
0100(empty screen, type “Normal”). Set the OK code field in the element list toOK_CODE.SE41 — create status
MAIN; bind theBACK/EXIT/CANCELfunction codes to F3 / Shift+F3 / F12.SE38 > Goto > Text Elements — fill in the text symbols and selection texts.
The flow logic of the dynpro in step two must be exactly this:
PROCESS BEFORE OUTPUT.
  MODULE status_0100.

PROCESS AFTER INPUT.
  MODULE user_command_0100.
The code uses classic ABAP syntax and compiles identically from ECC 6.0 through S/4HANA. I used CALL METHOD instead of the parenthesised method call so that systems at NetWeaver 7.00 level are not left out. If your system is not Unicode, convert the non-ASCII labels in the HTML to ASCII.
How far it goes, and where it stops
To be honest, this approach is not a BI platform and should not try to be one.
Where it is good: technical users who never leave SAP GUI, live SAP data, no extra licence, no extra infrastructure, authorization already in SAP, moves through the transport system. Excellent for result sets of a few thousand rows.
Its limits: you build the HTML in an ABAP string and ship it — not suitable for a 100,000-row data set, where you have to push the aggregation down to the database. Scheduled refresh, subscriptions, sharing, mobile, row-level security, self-service analysis — none of it is there. Trying to rebuild those with an HTML template means trying to imitate Power BI, and that does not end well.
Where the investment belongs: the presentation layer (HTML/JS) is the cheapest and most easily replaced part. The lasting value is in the CDS view. Move the aggregation into CDS and the same data model can serve an ABAP report, Fiori Elements, SAC and Power BI at the same time. The day someone says “we're moving to Power BI”, you throw away the ABAP report and keep your data model.
If you want to go further
Put ECharts into SMW0. Plain SVG is enough for simple charts; if you want treemaps, sankey diagrams, gauges or zoom, upload
echarts.min.jsas a MIME object in SMW0 and fetch its URL withload_mime_object( ). Still no internet required, still transportable.Add SM13 and SM21 — same pattern, about 20 lines inside
f_health.A daily email summary.
f_build_htmlalready produces a complete HTML document; sending it to the Basis team every morning at 07:00 withCL_BCSis just a background job.Move the thresholds into a table. They currently live on the selection screen; in a Z table you could define different thresholds per system.
Attachments(2)
Comments
Gorkem Ozdemir
30 Eylül 2026
Müthiş bir çalışma olmuş bende üzerine eklemeler yaparak test ediyorum hocam ellerinize sağlık.
Şükrü Demirhas
28 Ağustos 2026
Çok başarılı bir çalışma ellerine, emeğine sağlık...


